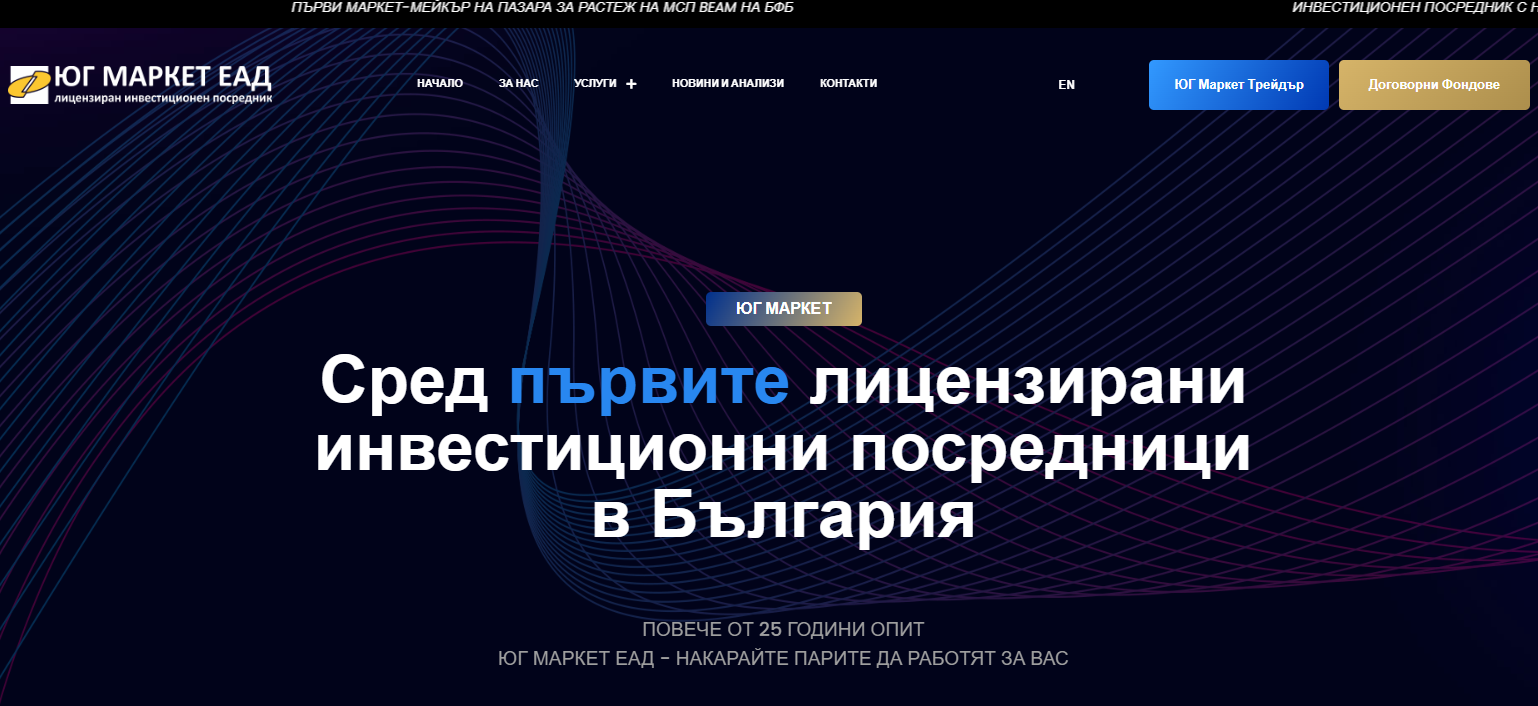
UG Market
UG Market Data Visualization and Management
UG Market, a platform for [insert company's services/products here - information not available on website], required enhanced data visualization capabilities to gain deeper insights into their operations and present information effectively.
Problem
UG Market lacked a system for creating and managing charts based on their data. They needed a solution that would allow them to visualize key performance indicators (KPIs) and other metrics in a user-friendly and informative way.
Our Role
-
Custom Plugin Development
-
Data Visualization
-
Database Creation
Solution
Database Creation:
Designed and implemented a database to store the data points required for chart generation.
Chart Generation:
Integrated Chart.js, a powerful JavaScript library, to create visually appealing and interactive charts.
Customizable Charts:
Provided options to customize chart types, colors, labels, and data sources, allowing UG Market to tailor visualizations to their specific needs.
Backend Data Management:
Developed a user-friendly interface within the WordPress backend for managing data points and updating charts.
Results
The custom plugin empowered UG Market with:
-
Gained the ability to visualize key data points, providing valuable insights into their operations and performance.
-
Data-driven visualizations facilitated better decision-making and strategic planning.
-
Streamlined data analysis and reporting processes.
-
The intuitive backend interface made it easy for UG Market to create and manage charts without technical expertise.
Conclusion
Classic Programmers successfully implemented a data visualization solution for UG Market, enabling them to leverage their data for informed decision-making and effective communication. If you're looking to enhance your data visualization capabilities and gain deeper insights into your business, visit ClassicProgrammers.com to learn how we can help.
Website: https://ugmarket.com/


